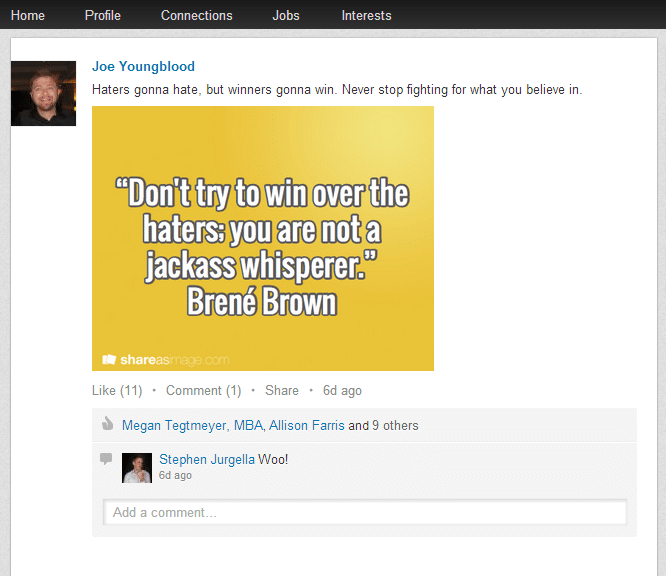
It seems almost every new post about social media marketing these days seeks to highlight LinkedIn as one of the most valuable for businesses, especially those in the B2B arena. LinkedIn has many of the same mechanics of other social networks with a few distinct differences. One of the similarities LinkedIn has is the ability to make a status update. This is also the most prominent (ok now second most prominent to “posts”) type of content that your connections are exposed to on LinkedIn. When you login you’re automatically served up a streaming feed of content posted and shared by your connections just like you would see on Facebook or Twitter. There’s a few problems with this feed in my opinion. First off, on web versions of LinkedIn, unlike Facebook and Twitter, this content can’t be found by visiting a persons profile page. Weirdly enough in the mobile app versions the content can be found by visiting someone’s profile and clicking on “Recent Activity” (hat tip: craig fisher) in the mobile app. That’s odd to me because LinkedIn SHOULD (not that I know for sure) see a large percentage of usage while people are at work, especially at office jobs where PCs and Laptop systems still rule as king. So why then is a useful feature only on mobile where fewer users would likely see it? I have no clue what that answer is, but it’s a tad perplexing.
Second is the fact that this content does not have a direct URL. Again on Twitter and Facebook you can share links directly to a ‘status update’ and share that singular piece of content with people no matter what social media outlet they are on. With Twitter you can even embed tweets into blog posts which has proven popular with journalists covering celebrities and trends on the social network.
So the question I wanted to know the answer to was out of all of this content that is basically shared once and left up to the LinkedIn algorithm to get visibility what content is the most successful and how can this information arm folks in the B2B space to be more successful. To get to this answer I spent weeks evaluating content shared by the connections in my network. This sample contains entry level to C-suite level folks in marketing and advertising, entertainment, high tech, and various other industries. I collected hundreds of instances and recorded the number of times content was commented on or liked to attempt to evaluate what content is more popular.
The content types I examined were:
- Advice / Affirmation (text only) – something that motivates or makes people feel good
- Article With Personal Commentary – a link to an article with one’s own personal opinion included
- Article Without Commentary – a link to an article without adding anything extra
- Business Call to Action on Personal Page – asking connections to do some business thing such as fill out a form, etc..
- Business Related Announcement – some announcement about one’s business or company without providing any links to content
- Business Related Announcement w/ Linked Content – some announcement about one’s business or company with a link to content
- Business Related Contest on LinkedIn – a contest ran on a personal page but by and to benefit one’s business or company
- Career Achievement Announcement – such as getting promoted, winning an award, touch Matt Cutt’s shirt just slightly, etc..
- General Interest Infographic – an infographic that would have broad appeal
- Job Opportunity – a job opening at one’s business or for one’s client
- New Job – a built in LinkedIn notification that someone has gotten a new job
- New Photo – a built in LinkedIn notification that someone has changed their photo
- Non-Occupational Related Photo – a photo that has nothing to do with one’s business or company (i.e. personal photo with a pet)
- Occupation Related Announcement – some announcement about one’s occupation that does not correlate to one’s business directly or count as an achievement (i.e. going to a conference)
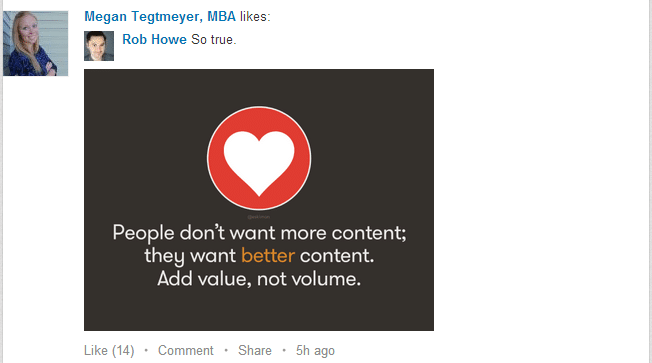
- Occupational Fact Graphic – a fact related to one’s occupation placed on an image, usually in mostly text
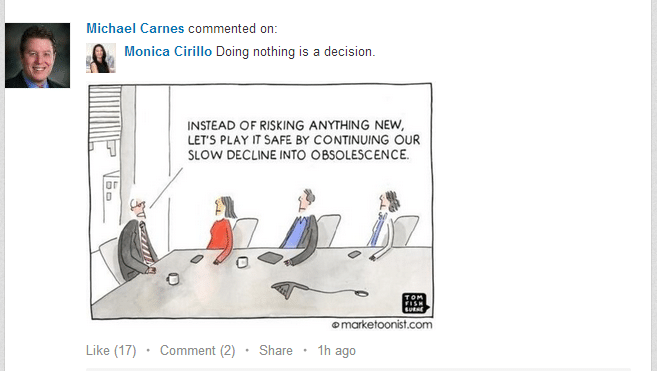
- Occupational Humor Graphic – a comic strip, funny quote, or other joke related to one’s occupation in image form
- Personal Blog Post – a blog post on one’s personal site not related to work at all
- Professional Tips / Insights (text only) – professional tips, pro tips, etc… in only text form
- Request for Help / Comments – a query given to one’s network often for related industry knowledge
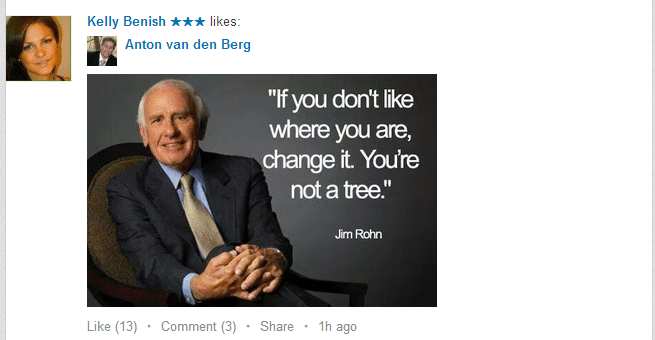
- Text Advice/Affirmation Graphic – a graphic with a motivational or inspirational quote or saying
- Work Anniversary – a built in LinkedIn notification that one has worked somewhere for another year
Here’s a few examples of what they look like:
1. Occupational Humor Graphic
2. Text Advice/Affirmaton Graphic
3. Occupational Fact Graphic
4. Professional Tips / Insights (text only)

The Results: Graphs
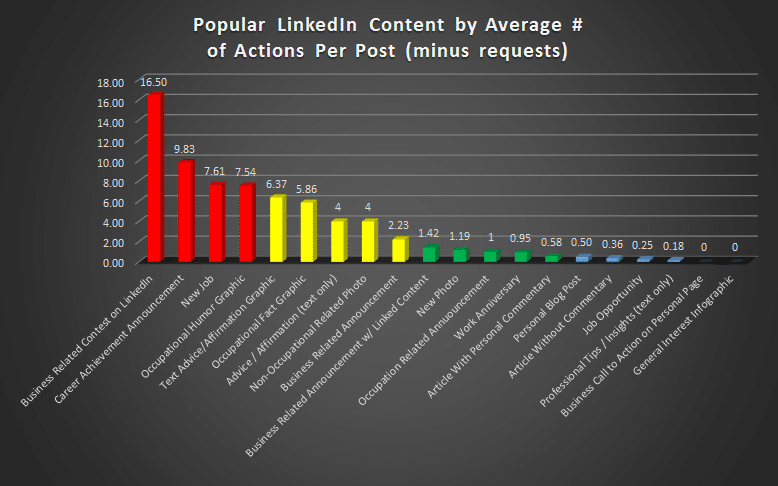
After collecting the data I factored the average Likes and Comments per post type, the percentage of the total number of shares a post type had, and the average actions between likes and comments per post type.
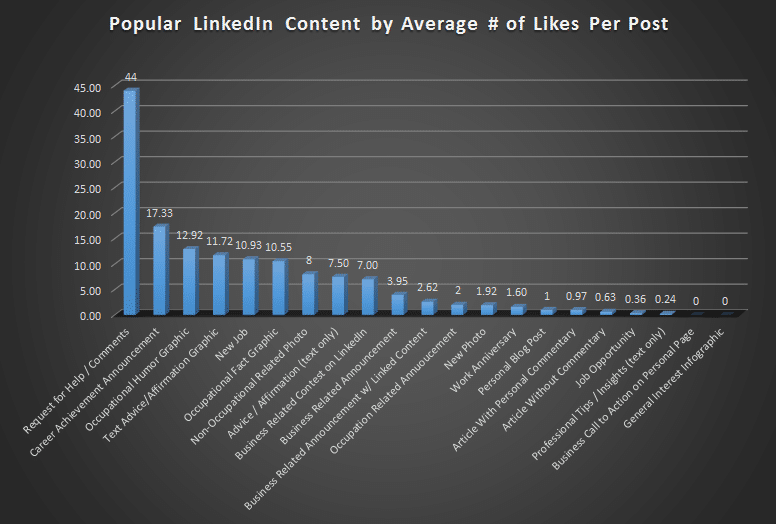
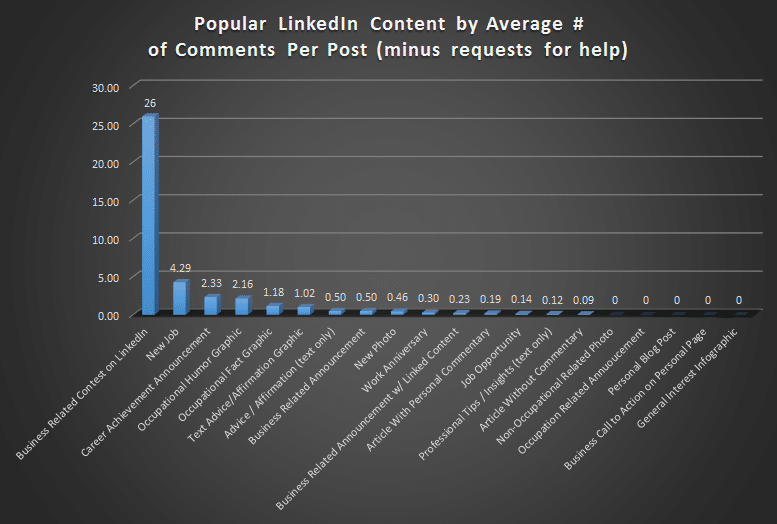
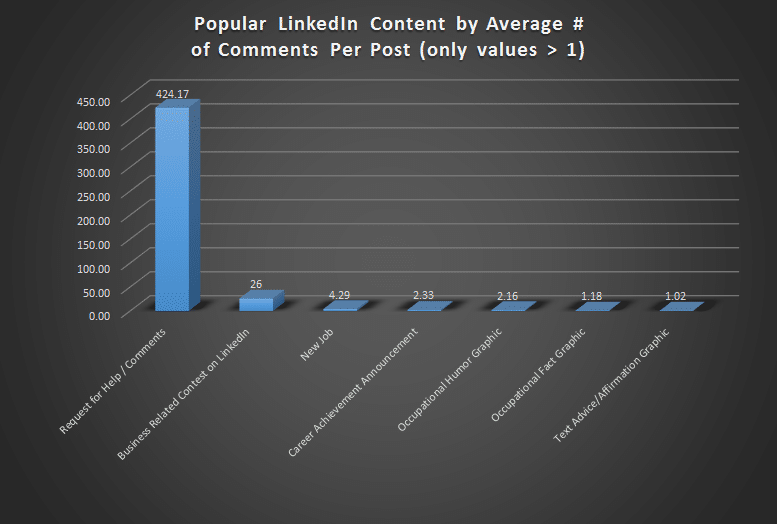
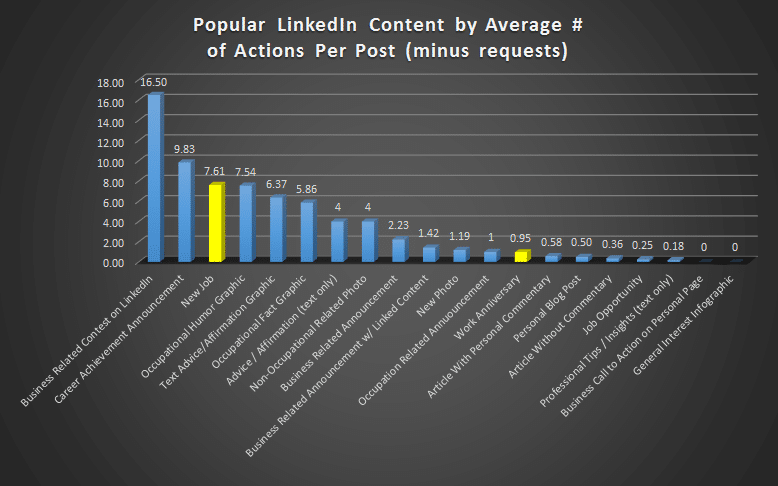
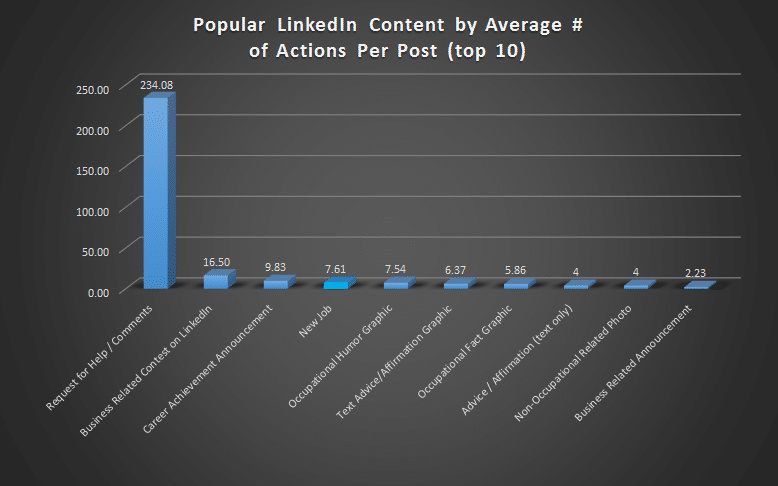
I color coded a few of the graphs to better illustrate what’s happening. Red = top 1-5, Yellow 6-10, Green 11-15, and Blue the rest in terms of average actions per post. Looking at these graphs it’s pretty clear that the content getting shared on LinkedIn about half the time is not what people are actively engaging with.
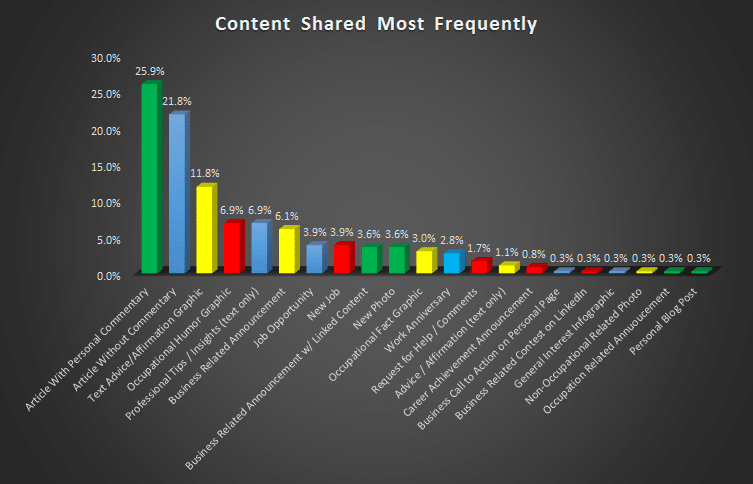
As the graph above shows, at least half of the content that is shared most often are from the two groups of the least popular content in the study.
According to this data posts matched with image content that leaves the user feeling good is very popular. Either humor, motivational quotes, or industry knowledge. Posts that contain just text are less popular and seem to gather fewer comments and likes, unless that post is asking the connections a question or for some help or advice. Some of the worst performing content also seems to be the most popular to share including just posting a link without providing any commentary, or posting unsolicited professional tips or advice.
The data seems to show that a large percentage of the content you share on LinkedIn content should be image based, some of that should contain some personal commentary, and you should rarely or never post links without any personal commentary or anything that is visually appealing. The data also appears to suggest that you should ask questions of your connections, this might not be as popular as some might think it signifies a weakness in their knowledge. Marketing industry heavyweights like Rand Fishkin and others in digital marketing frequently query their audience without losing face, examining how they do this might be the way to ask questions and get input on your LinkedIn page.
Of note is the fact that LinkedIn allows images no wider than 350px, anything larger will be scaled down and, as I discovered, make it difficult to read any text you added to the graphic.
I’m not entirely sure how helpful this data is in helping you optimize your postings on LinkedIn. Personally I’ve begun using it to try and promote blog posts by finding a related quote and making a graphic, or taking a quote from that blog post and making a graphic. This study did not, however, look at click-thru frequency. It is possible that the least popular post types could be the most clicked on and vice versa.
Personally I’m using the above data simply to interact with colleagues I might not see or talk to frequently, in hopes of reminding them that I’m alive and staying top of their minds in case they are ever in a position to hire me. I’m also examining the data for ways to boost traffic from my LinkedIn to blog posts and to boost the visibility the digital marketing group I sit on the board for, DFWSEM, among my group of connections. Sales force heavy companies such as recruiting firms, consulting firms, etc.. might find this data useful to best display industry knowledge and gain interaction with their target audience from personal accounts as well.
Here’s the most popular post I’ve made so far on LinkedIn, and it was thanks to this research.
What ways will this impact your LinkedIn strategy? Tell me in the comments.
Further Research
Want to learn more about LinkedIn optimization? Craig Fisher has done a lot more work with the platform than I have.
Check out Craig Fisher’s blog here: http://blog.fishdogs.com/search/label/LinkedIn
Or if you want to examine the data you can click here to download the excel doc:
LinkedIn Content Study Data

